Master the Primary Flight Display: Pilot Insights
The primary flight display (PFD) represents the most critical instrument in modern cockpits, serving as the pilot’s window into aircraft performance, attitude, and navigation data. Whether you’re a seasoned aviator or aspiring to join the ranks of professional pilots, understanding the PFD is fundamental to safe and efficient flight operations. This comprehensive guide explores the intricacies of primary flight displays, their components, interpretation techniques, and practical applications that separate exceptional pilots from average ones.
In contemporary glass cockpit environments, the PFD consolidates information that once required multiple analog instruments, presenting unified data that enhances situational awareness and reduces cognitive workload. From altitude and airspeed to heading and vertical speed, every critical parameter flows through this single interface. Mastering interpretation of these displays isn’t merely academic—it’s the difference between routine flights and successfully managing unexpected situations with confidence and precision.
Understanding Primary Flight Display Architecture
The primary flight display evolved from necessity—pilots needed instantaneous access to flight-critical data without scanning multiple instruments across the instrument panel. Traditional round-dial instruments required scanning patterns that consumed precious seconds during critical phases of flight. The PFD consolidates this information into a logical, organized layout that prioritizes the most essential parameters.
Modern PFDs follow standardized designs established by aviation authorities and manufacturers, ensuring pilots can transition between aircraft with minimal retraining. The display typically features a horizon line representing aircraft attitude, with pitch and bank information conveyed through intuitive visual cues. Speed tape on the left, altitude tape on the right, and heading information at the bottom create a familiar framework that experienced pilots can interpret instantaneously.
Understanding the flight controller systems that feed data to the PFD helps pilots appreciate the reliability and redundancy built into modern avionics. Most glass cockpit systems incorporate multiple air data computers, inertial reference systems, and GPS receivers that cross-check information and alert pilots to discrepancies. This architectural redundancy means the PFD you’re reading has been verified by multiple independent systems.
Core Instruments and Data Presentation
The PFD integrates six fundamental instruments that pilots historically scanned individually: attitude indicator, airspeed indicator, altimeter, vertical speed indicator, heading indicator, and turn coordinator. Each occupies a specific position within the display, maintaining consistency across different aircraft and manufacturers.
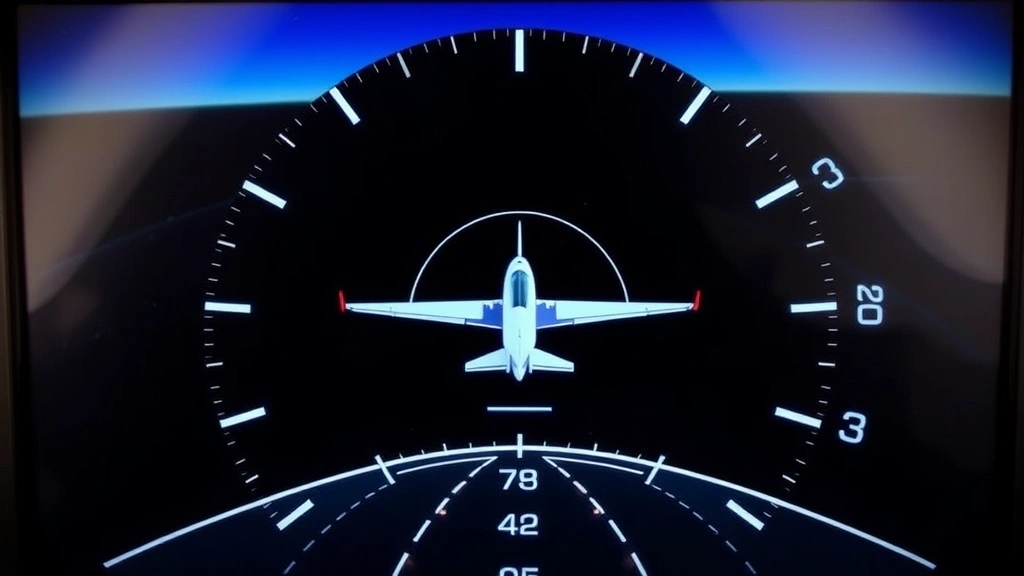
The Artificial Horizon dominates the center of the display, showing aircraft pitch and bank attitude relative to the natural horizon. Blue represents sky, brown represents earth, and the aircraft symbol (typically a small airplane or chevron) remains fixed in the center. The horizon line moves relative to this symbol, providing intuitive pitch and bank information.
Speed Tape Display appears on the left side, presenting current airspeed vertically with numerical values. Green arcs indicate normal operating range, white arcs show flap operating speeds, and red lines mark never-exceed speeds. This tape format allows pilots to quickly assess speed trends and margins without reading specific numbers.
Altitude Tape mirrors the speed tape on the right side, showing current altitude with trend indicators. Selected altitude appears as a small target symbol, allowing pilots to visualize climb or descent requirements. The tape format makes altitude changes immediately apparent through motion rather than requiring numerical interpretation.
Vertical Speed Indicator traditionally appears below the altitude tape, showing climb or descent rate in feet per minute. Modern PFDs often integrate this as a trend vector on the altitude tape, eliminating a separate instrument and reducing display clutter.
Heading Indicator occupies the bottom of the display, showing current magnetic heading with selected heading displayed as a bug or target. Compass roses and navigation course information integrate seamlessly with this element.
Reading Attitude and Bank Information
The attitude indicator provides the most fundamental flight information—how your aircraft is oriented relative to the horizon. Pilots must develop reflexive understanding of what different pitch and bank angles look like on the display, allowing instant recognition without conscious thought.
Pitch is conveyed through the position of the aircraft symbol relative to the horizon line. Small pitch angle markings (typically at 5 or 10-degree intervals) help quantify pitch attitude precisely. During normal cruise, the horizon line typically appears slightly below the aircraft symbol. During climb, the line moves downward; during descent, it moves upward.
Bank angle is equally critical, shown through rotation of the horizon line around the aircraft symbol. Most PFDs include bank angle scales at the top showing 10, 20, and 30-degree marks. Steep banks become immediately obvious as the horizon line rotates significantly. Developing quick recognition of standard-rate turns (approximately 3 degrees per second) becomes automatic through practice.
The relationship between pitch, bank, and power determines aircraft performance. A pilot proficient with the primary flight display can instantly recognize when pitch and power settings aren’t producing expected results, allowing rapid correction. This skill develops through repeated exposure and deliberate practice, making flight training investments worthwhile.
Altitude and Vertical Speed Interpretation
Altitude management represents one of the most regulated aspects of flight operations. The altitude tape must be read with precision—confusing one thousand feet can create serious compliance issues. Modern PFDs reduce errors through large, clear numerical displays and trend indicators that show whether altitude is increasing or decreasing.
The selected altitude bug (a small target symbol on the altitude tape) helps pilots visualize altitude changes needed. If current altitude is below the selected altitude, the bug appears above; if above, the bug appears below. This visual representation immediately communicates climb or descent requirements without requiring mental calculation.
Vertical speed trends indicate climb or descent rate, typically measured in feet per minute. A descent rate of 500 feet per minute at altitude requires approximately 3-5 minutes to descend 1,500 feet. Proficient pilots use vertical speed information combined with distance-to-altitude targets to plan smooth, controlled altitude changes.
Understanding altitude constraints is critical for professional operations. Controllers assign altitudes at specific fixes, and pilots must plan descents to meet these restrictions. The primary flight display provides the real-time information needed to execute these transitions precisely. Pilots working toward flight dispatcher positions must understand how altitude management affects routing and fuel planning.
Airspeed and Speed Management
The speed tape presents airspeed information in a format that makes trends immediately apparent. Rather than reading a numerical value and comparing it to previous mental snapshots, pilots observe speed tape movement indicating acceleration or deceleration. This format reduces workload and increases precision.
Colored arcs on the speed tape indicate different operating regimes. Green arc represents normal operating range for typical operations. White arc indicates flap-operating speeds—speeds at which flaps can be safely extended. Red line marks never-exceed speed (VNE), which cannot be exceeded under any circumstances. Yellow arc indicates caution range where flight is possible but not recommended during normal operations.
Speed management varies throughout flight phases. During takeoff and climb, pilots manage speed to balance climb performance with engine temperatures. During cruise, speed selection balances fuel efficiency with time-to-destination. During descent and approach, speed management becomes critical as flaps extend and landing gear deploys, each imposing new speed restrictions.
The AI101 flight tracking systems monitor speed compliance during operations, making accurate speed tape interpretation essential for professional pilots. Exceeding speed restrictions can trigger monitoring alerts and regulatory scrutiny.
Navigation and Heading Information
The heading indicator at the bottom of the PFD integrates navigation information with compass heading display. The heading bug (selected heading target) appears as a small arrow or triangle, allowing pilots to visualize required heading changes. Magnetic variation automatically accounts for magnetic declination, ensuring displayed headings match real-world compass orientation.
Navigation courses appear overlaid on the heading indicator, typically shown as course deviation indicators (CDI) that display whether the aircraft is left or right of the desired course. The course selector allows pilots to input desired navigation courses, and the display immediately shows deviation from that course.
During instrument approaches, the heading indicator becomes critical for maintaining proper alignment with runways. Pilots must smoothly roll out on assigned headings while descending to minimums, a task that requires constant reference to the heading information on the PFD. Proficiency develops through deliberate practice and exposure to varied approach conditions.
Advanced PFD Features and Alerts
Modern primary flight displays incorporate sophisticated alerting and protection systems that enhance safety margins. Terrain awareness and warning systems (TAWS) overlay terrain information on the display, providing visual and audible alerts if the aircraft descends toward ground. This capability has saved countless lives by providing early warning of unintentional descents.
Synthetic vision technology creates three-dimensional representations of terrain, buildings, and obstacles, allowing pilots to navigate safely in low-visibility conditions. Some systems even display weather radar information integrated with the terrain display, providing comprehensive situational awareness.
Autopilot integration means the PFD displays autopilot mode, coupled approach information, and altitude hold parameters. Understanding how autopilot modes interact with PFD information is essential for modern pilots. While automation reduces workload, pilots must maintain constant awareness of what the autopilot is doing and be prepared to intervene immediately if needed.
Flight director commands appear as a crosshair or target symbol on the PFD, providing steering guidance to follow approaches or maintain altitudes. Pilots flying the flight director simply position the aircraft symbol to follow the command cues, reducing workload and increasing precision during complex procedures.
Practical Training Strategies
Mastering the primary flight display requires deliberate, progressive training. Initial ground instruction should establish the fundamental layout and function of each element. Simulator training allows repeated exposure to varied scenarios without the risk or expense of actual flight. Pilots should practice interpreting PFD information during normal operations, unusual attitudes, and emergency scenarios.
Scenario-Based Training proves most effective for developing real-world proficiency. Practice approaches under various weather conditions, simulate engine failures at different flight phases, and rehearse unusual attitude recovery procedures. Each scenario reinforces PFD interpretation skills while building confidence for actual operations.
Cross-Cockpit Observation provides valuable learning opportunities. Observing experienced pilots interpret PFD information during actual flights demonstrates real-world applications and best practices. Most professional pilots welcome questions from colleagues interested in improving their skills.
Recurrent Training maintains proficiency throughout a pilot’s career. Regulatory requirements mandate periodic training and checking, but effective pilots exceed minimum requirements through continuous self-improvement. Staying current with new PFD features and improvements ensures pilots leverage available technology fully.
Understanding how the flight dispatcher coordinates with flight crews using PFD information helps pilots appreciate the broader operational context. Dispatchers plan routes based on expected performance data displayed on the PFD, making accurate speed and altitude management essential for meeting dispatch predictions.
Investment in training pays dividends throughout a pilot’s career. Whether pursuing professional aviation careers or flying recreationally, PFD proficiency directly impacts safety margins and operational success. The skills developed mastering this display transfer across aircraft types and operational environments.
FAQ
What is the primary purpose of a primary flight display?
The PFD consolidates flight-critical information including attitude, altitude, airspeed, heading, and vertical speed into a single integrated display, allowing pilots to maintain situational awareness efficiently. It replaces traditional round-dial instruments with a modern glass cockpit format that reduces scanning workload and enhances precision.
How do I interpret the speed tape on a PFD?
The speed tape displays airspeed vertically with the current speed at the center index. Colored arcs indicate operating regimes: green for normal operations, white for flap-operating speeds, and red for never-exceed limits. Tape movement indicates acceleration or deceleration trends, making speed changes immediately apparent.
What do the colored arcs on the altitude tape indicate?
The altitude tape primarily displays current altitude with a selected altitude bug showing the target altitude. Trend vectors indicate climb or descent rate. The display uses clear numerical values and visual positioning to help pilots quickly assess altitude margins and plan altitude changes.
Can I rely solely on the PFD for navigation?
The PFD provides heading and course deviation information integrated with navigation systems, allowing successful instrument approaches and en route navigation. However, pilots must cross-check PFD information with other navigation sources and maintain awareness of system limitations, particularly regarding GPS availability and accuracy.
How does autopilot integration affect PFD interpretation?
Autopilot modes and status display on the PFD, showing active modes and coupled approach information. Pilots must understand what the autopilot is doing and maintain constant awareness, ready to intervene immediately. The PFD displays flight director commands that help pilots understand autopilot intentions.
What synthetic vision features might appear on my PFD?
Advanced PFDs display three-dimensional terrain representations, building outlines, and obstacle positions. Some systems integrate weather radar information and provide terrain awareness warnings if the aircraft descends toward ground. These features significantly enhance situational awareness, particularly in low-visibility conditions.